Extract EICs of some features
Xiaotao Shen (https://www.shenxt.info/)
Created on 2020-04-01 and updated on 2022-09-19
Source:vignettes/extract_eic.Rmd
extract_eic.RmdExtract EICs of some features
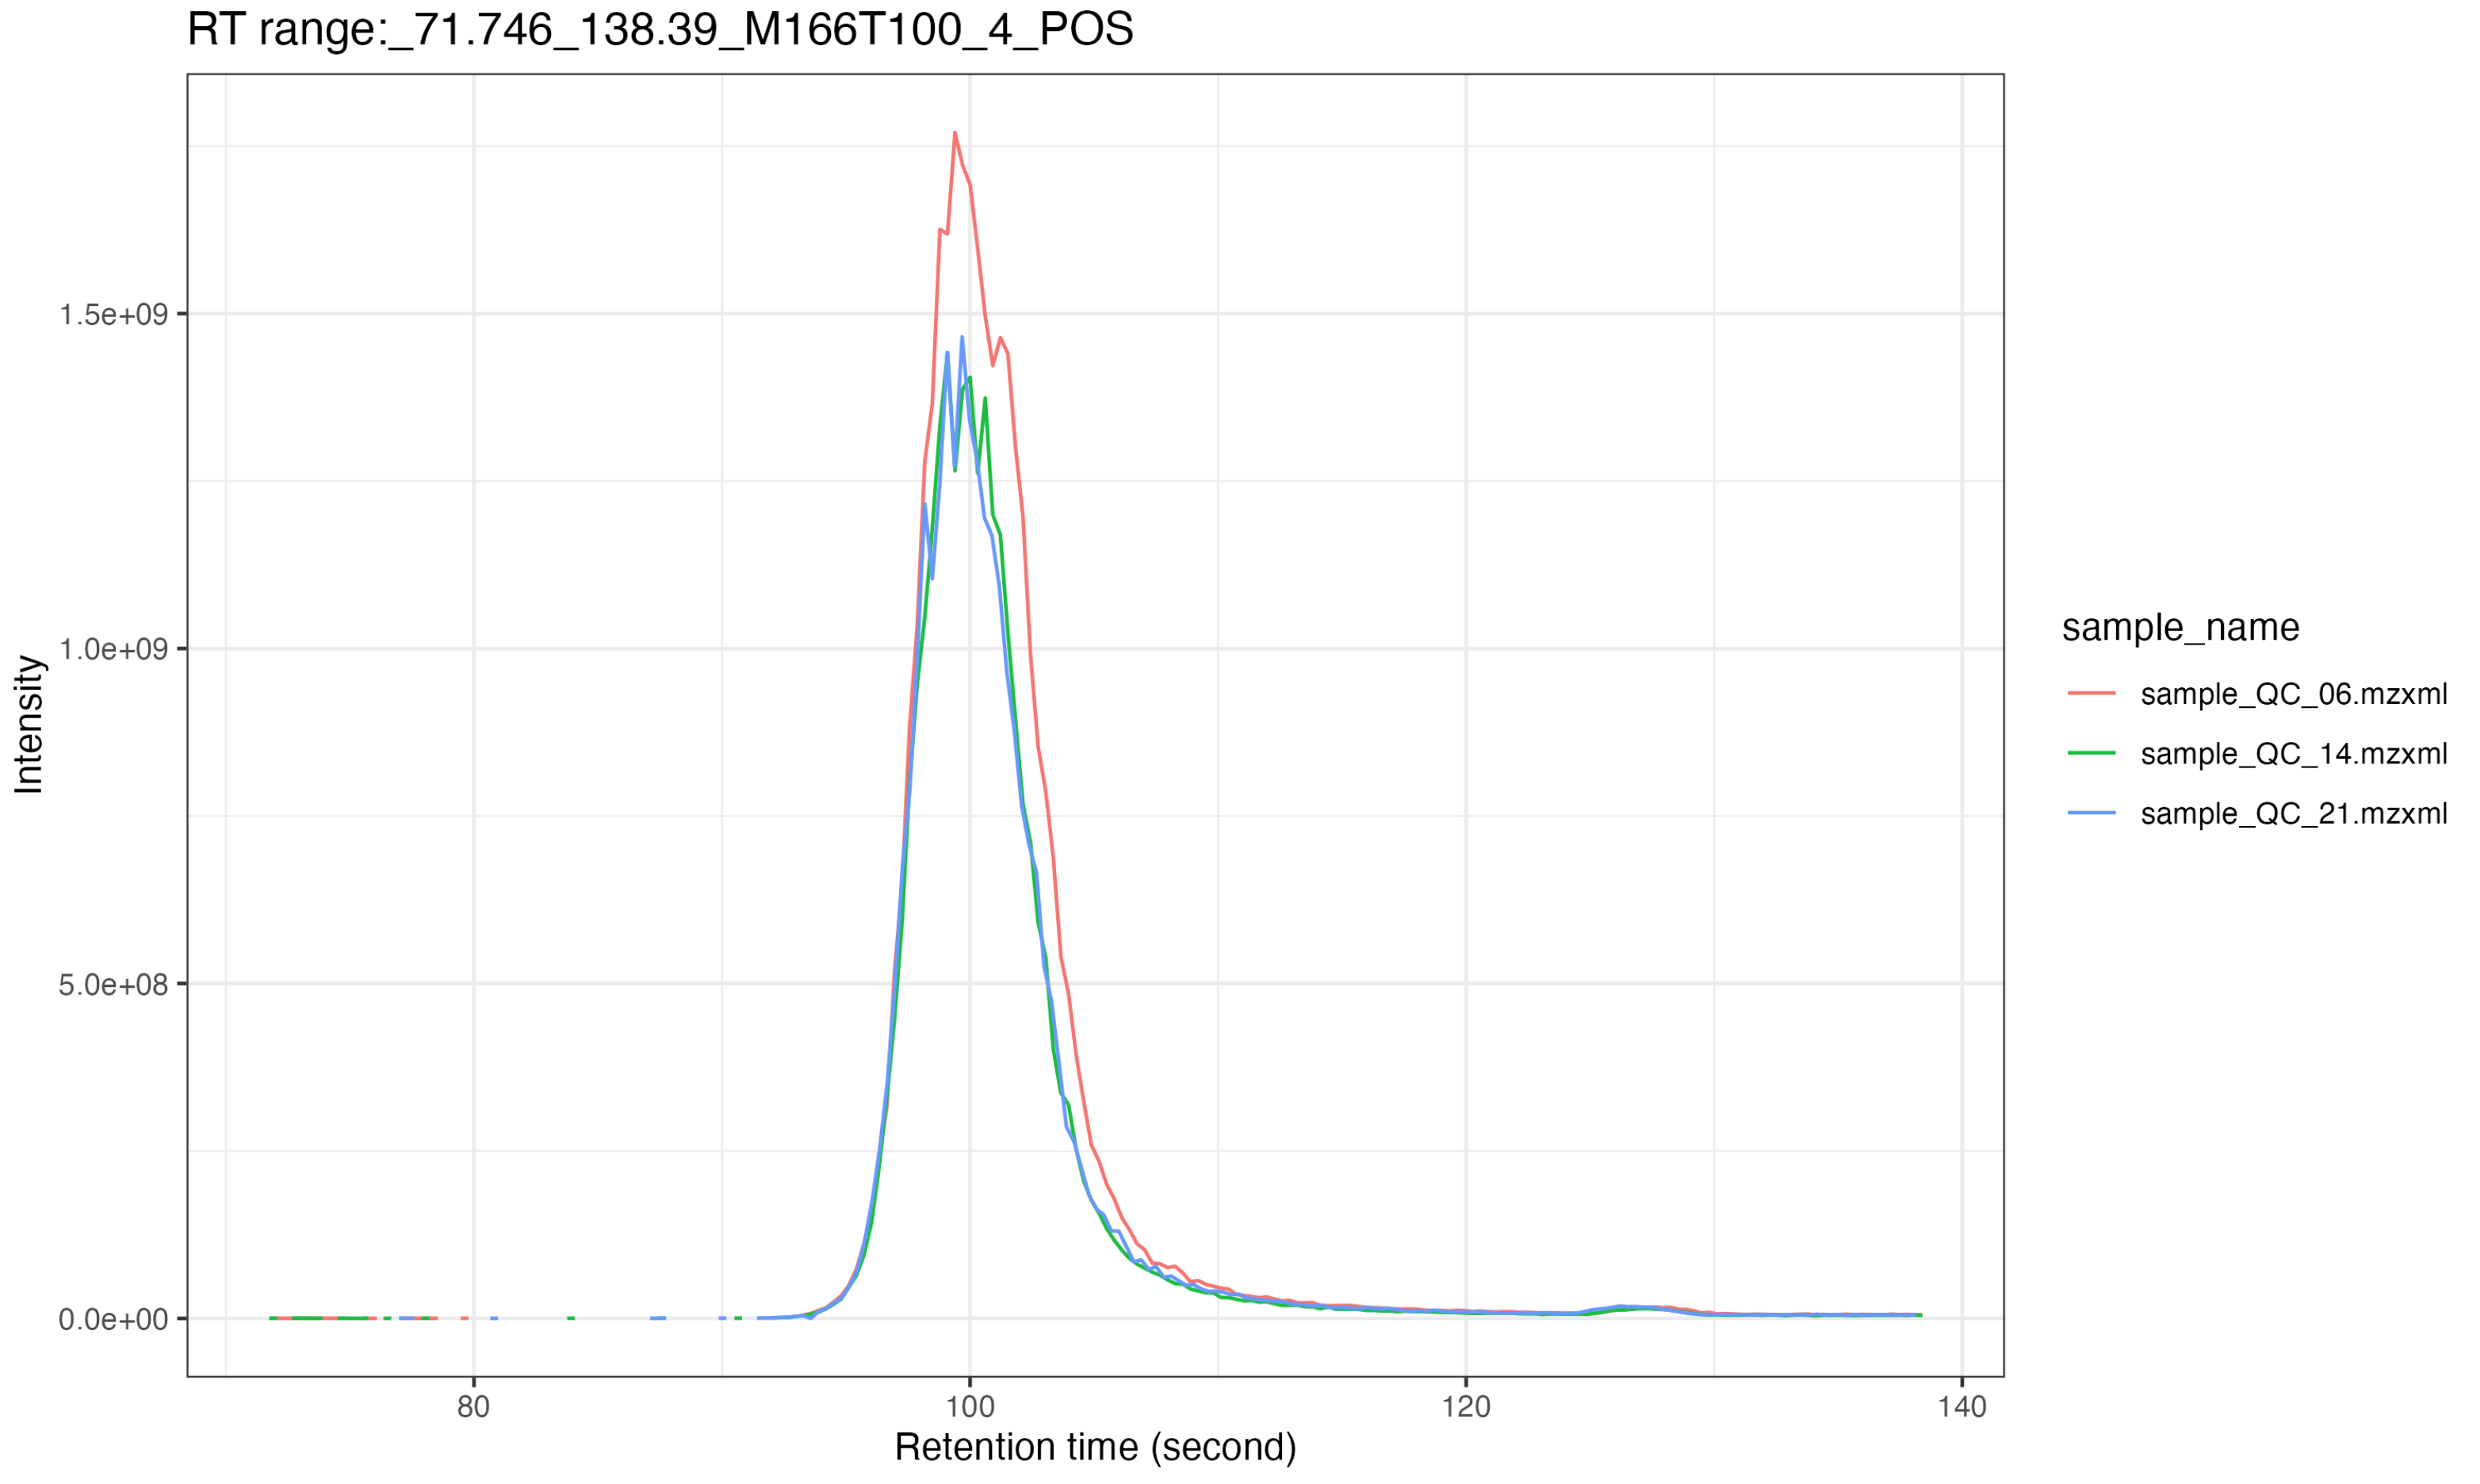
massprocesser can be used to extract of EICs of some
features, so you can evaluate the peak shape quality of targeted
features.
We still use the Result from Raw MS data processing using massprocesser as a example.
Data preparation
Targeted feature label
Here we just want to extract the feature with top 10 abundance in all samples.
targeted_table =
  readr::read_csv("massprocesser_demo_data/POS/Result/Peak_table_for_cleaning.csv")

mean_int = targeted_table %>%
  dplyr::select(-c(variable_id:rt)) %>%
  apply(1, function(x){
    mean(x, na.rm = TRUE)
  })

targeted_table =
targeted_table %>%
  dplyr::select(variable_id:rt) %>%
  dplyr::mutate(mean_int = mean_int) %>%
  dplyr::arrange(dplyr::desc(mean_int)) %>%
  head(10) %>%
  dplyr::select(-mean_int)

targeted_table
#> # A tibble: 10 × 3
#>    variable_id       mz    rt
#>    <chr>          <dbl> <dbl>
#>  1 M163T776_3_POS  163.  776.
#>  2 M166T100_4_POS  166.  100.
#>  3 M163T666_POS    163.  666.
#>  4 M131T776_POS    131.  776.
#>  5 M311T315_2_POS  311.  315.
#>  6 M353T695_4_POS  353.  695.
#>  7 M120T100_3_POS  120.  100.
#>  8 M206T791_POS    206.  791.
#>  9 M135T824_POS    135.  824.
#> 10 M192T803_POS    192.  803.
You can also use the mass_dataset class object to get
the targeted_table.
library(massdataset)
load("massprocesser_demo_data/POS/Result/object")
object
#> --------------------
#> massdataset version: 0.99.1
#> --------------------
#> 1.expression_data:[ 15597 x 9 data.frame]
#> 2.sample_info:[ 9 x 4 data.frame]
#> 3.variable_info:[ 15597 x 3 data.frame]
#> 4.sample_info_note:[ 4 x 2 data.frame]
#> 5.variable_info_note:[ 3 x 2 data.frame]
#> 6.ms2_data:[ 0 variables x 0 MS2 spectra]
#> --------------------
#> Processing information (extract_process_info())
#> 2 processings in total
#> create_mass_dataset ----------
#>       Package         Function.used                Time
#> 1 massdataset create_mass_dataset() 2022-01-15 00:34:49
#> process_data ----------
#>         Package Function.used                Time
#> 1 massprocesser  process_data 2022-01-15 00:05:38
###add mean intensity to variable information
object =
object %>%
massdataset::mutate_mean_intensity()
targeted_table2 =
object %>%
activate_mass_dataset(what = "variable_info") %>%
dplyr::arrange(desc(mean_int)) %>%
head(10) %>%
extract_variable_info() %>%
dplyr::select(variable_id, mz, rt)
targeted_table2
#> variable_id mz rt
#> M163T776_3_POS M163T776_3_POS 163.0277 776.2580
#> M166T100_4_POS M166T100_4_POS 166.0863 100.2956
#> M163T666_POS M163T666_POS 163.0241 666.0185
#> M131T776_POS M131T776_POS 131.0016 776.4105
#> M311T315_2_POS M311T315_2_POS 311.0808 315.1178
#> M353T695_4_POS M353T695_4_POS 353.2661 694.9374
#> M120T100_3_POS M120T100_3_POS 120.0808 100.2956
#> M206T791_POS M206T791_POS 205.9873 791.4752
#> M135T824_POS M135T824_POS 134.9966 824.1867
#> M192T803_POS M192T803_POS 191.9716 802.7890Load intermediate data
Load the intermediate data “xdata3” from Result
folder.
load("massprocesser_demo_data/POS/Result/intermediate_data/xdata3")Data processing
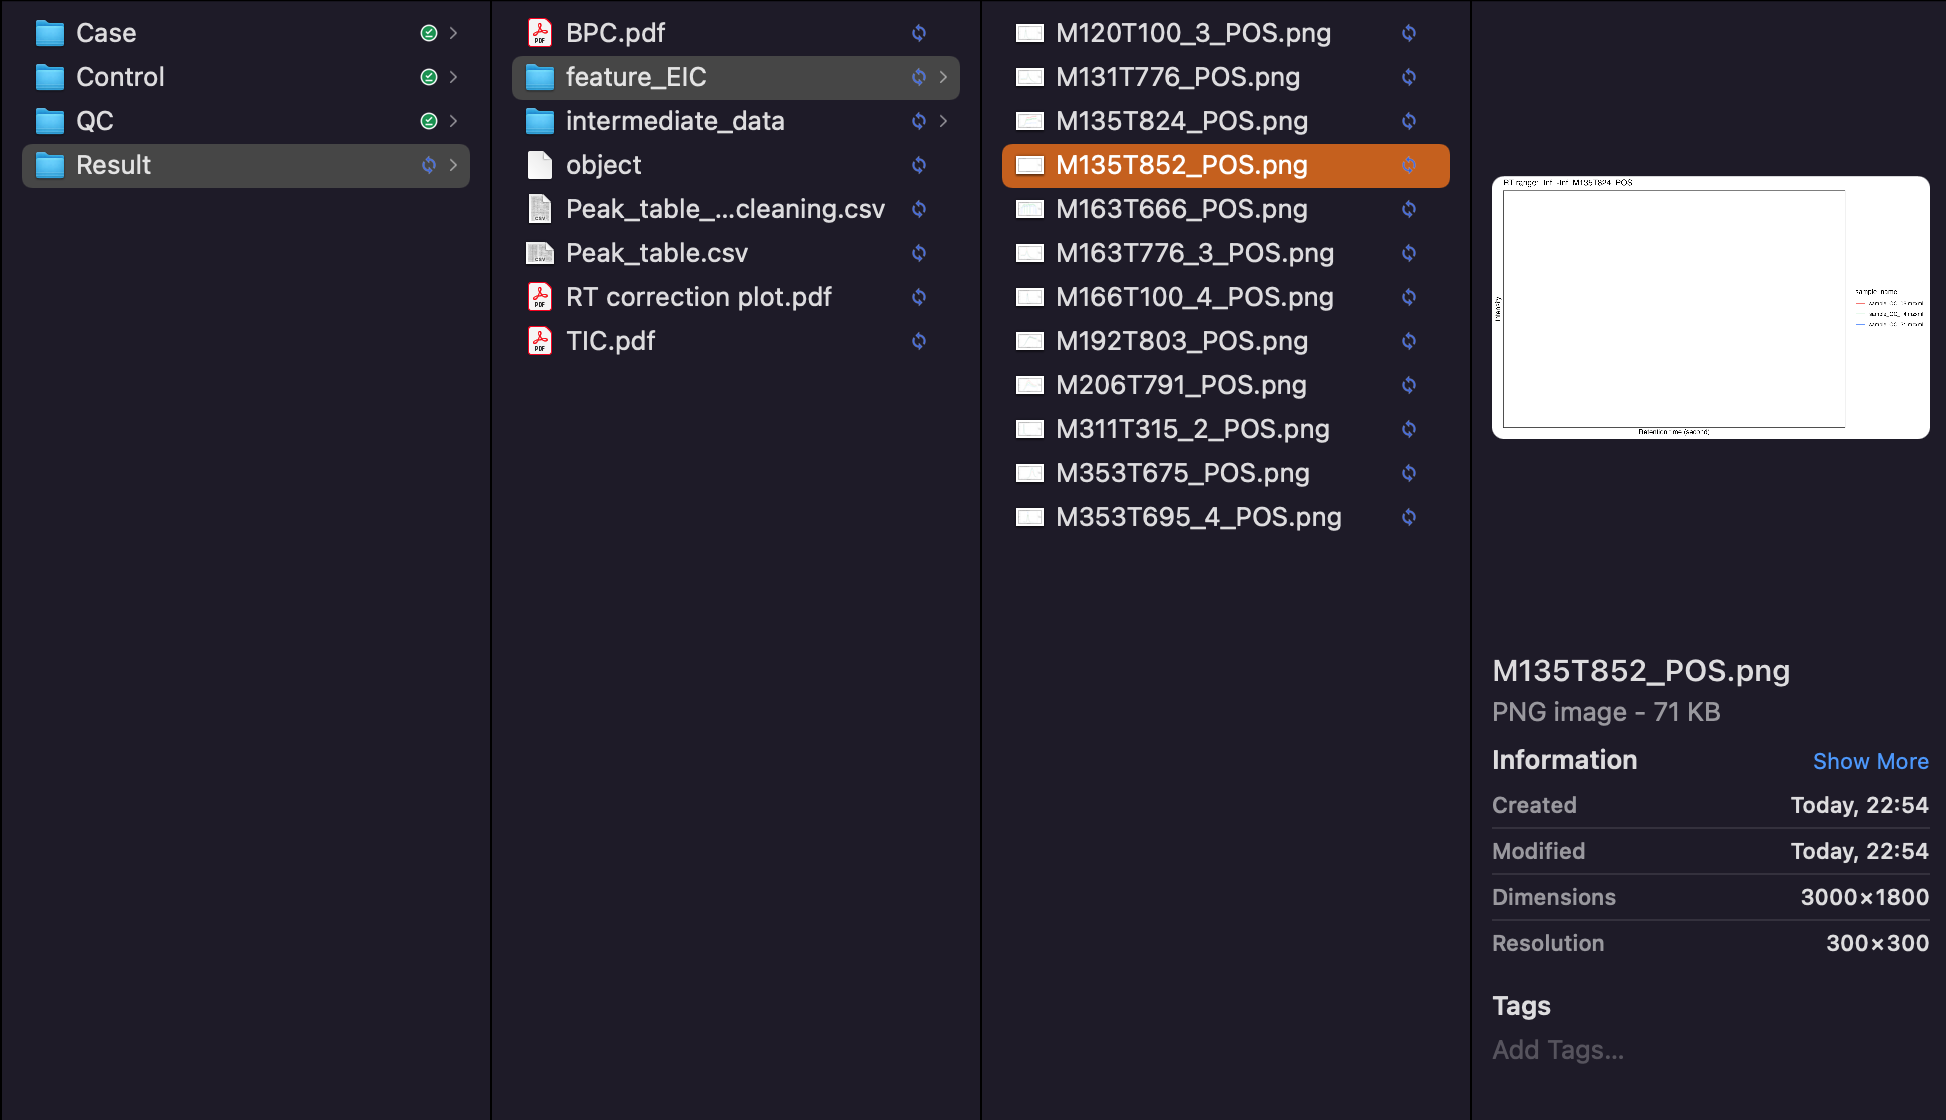
Next, we use the extract_eic() to extract feature EICs.
And the results are placed in raw_data/MS1/POS/Result
extract_eic(
  targeted_table = targeted_table,
  object = xdata3,
  polarity = "positive",
  mz_tolerance = 15,
  rt_tolerance = 30,
  threads = 5,
  add_point = FALSE,
  path = "massprocesser_demo_data/POS/Result",
  group_for_figure = "QC",
  feature_type = "png"
)
All the result will be outputted in
massprocesser_demo_data/POS/feature_EIC.

Session information
sessionInfo()
#> R Under development (unstable) (2022-01-11 r81473)
#> Platform: x86_64-apple-darwin17.0 (64-bit)
#> Running under: macOS Big Sur/Monterey 10.16
#>
#> Matrix products: default
#> BLAS:   /Library/Frameworks/R.framework/Versions/4.2/Resources/lib/libRblas.0.dylib
#> LAPACK: /Library/Frameworks/R.framework/Versions/4.2/Resources/lib/libRlapack.dylib
#>
#> locale:
#> [1] en_US.UTF-8/en_US.UTF-8/en_US.UTF-8/C/en_US.UTF-8/en_US.UTF-8
#>
#> attached base packages:
#> [1] stats4    stats     graphics  grDevices utils     datasets  methods
#> [8] base
#>
#> other attached packages:
#>  [1] magrittr_2.0.1       tinytools_0.9.1      massdataset_0.99.1
#>  [4] forcats_0.5.1        stringr_1.4.0        dplyr_1.0.7
#>  [7] purrr_0.3.4          readr_2.1.1          tidyr_1.1.4
#> [10] tibble_3.1.6         ggplot2_3.3.5        tidyverse_1.3.1
#> [13] xcms_3.17.1          MSnbase_2.21.3       ProtGenerics_1.27.2
#> [16] S4Vectors_0.33.10    mzR_2.29.1           Rcpp_1.0.7
#> [19] Biobase_2.55.0       BiocGenerics_0.41.2  BiocParallel_1.29.10
#> [22] massprocesser_0.9.2
#>
#> loaded via a namespace (and not attached):
#>   [1] circlize_0.4.14             readxl_1.3.1
#>   [3] backports_1.4.1             systemfonts_1.0.3
#>   [5] plyr_1.8.6                  lazyeval_0.2.2
#>   [7] crosstalk_1.2.0             leaflet_2.0.4.1
#>   [9] GenomeInfoDb_1.31.1         digest_0.6.29
#>  [11] yulab.utils_0.0.4           foreach_1.5.1
#>  [13] htmltools_0.5.2             fansi_1.0.0
#>  [15] memoise_2.0.1               cluster_2.1.2
#>  [17] doParallel_1.0.16           openxlsx_4.2.5
#>  [19] tzdb_0.2.0                  limma_3.51.2
#>  [21] ComplexHeatmap_2.11.0       modelr_0.1.8
#>  [23] matrixStats_0.61.0          vroom_1.5.7
#>  [25] MsFeatures_1.3.0            pkgdown_2.0.1
#>  [27] colorspace_2.0-2            rvest_1.0.2
#>  [29] textshaping_0.3.6           haven_2.4.3
#>  [31] xfun_0.29                   crayon_1.4.2
#>  [33] RCurl_1.98-1.5              jsonlite_1.7.2
#>  [35] impute_1.69.0               iterators_1.0.13
#>  [37] glue_1.6.0                  gtable_0.3.0
#>  [39] zlibbioc_1.41.0             XVector_0.35.0
#>  [41] GetoptLong_1.0.5            DelayedArray_0.21.2
#>  [43] shape_1.4.6                 DEoptimR_1.0-10
#>  [45] scales_1.1.1                vsn_3.63.0
#>  [47] DBI_1.1.2                   viridisLite_0.4.0
#>  [49] clue_0.3-60                 gridGraphics_0.5-1
#>  [51] bit_4.0.4                   preprocessCore_1.57.0
#>  [53] clisymbols_1.2.0            MsCoreUtils_1.7.1
#>  [55] htmlwidgets_1.5.4           httr_1.4.2
#>  [57] RColorBrewer_1.1-2          ellipsis_0.3.2
#>  [59] pkgconfig_2.0.3             XML_3.99-0.8
#>  [61] sass_0.4.0                  dbplyr_2.1.1
#>  [63] utf8_1.2.2                  ggplotify_0.1.0
#>  [65] tidyselect_1.1.1            rlang_0.4.12
#>  [67] munsell_0.5.0               cellranger_1.1.0
#>  [69] tools_4.2.0                 cachem_1.0.6
#>  [71] cli_3.1.0                   generics_0.1.1
#>  [73] broom_0.7.11                evaluate_0.14
#>  [75] fastmap_1.1.0               mzID_1.33.0
#>  [77] yaml_2.2.1                  ragg_1.2.1
#>  [79] bit64_4.0.5                 knitr_1.37
#>  [81] fs_1.5.2                    zip_2.2.0
#>  [83] robustbase_0.93-8           RANN_2.6.1
#>  [85] ncdf4_1.17                  pbapply_1.5-0
#>  [87] xml2_1.3.3                  compiler_4.2.0
#>  [89] rstudioapi_0.13             plotly_4.10.0
#>  [91] png_0.1-7                   affyio_1.65.0
#>  [93] reprex_2.0.1                MassSpecWavelet_1.61.0
#>  [95] bslib_0.3.1                 stringi_1.7.6
#>  [97] desc_1.4.0                  lattice_0.20-45
#>  [99] Matrix_1.4-0                ggsci_2.9
#> [101] vctrs_0.3.8                 pillar_1.6.4
#> [103] lifecycle_1.0.1             BiocManager_1.30.16
#> [105] GlobalOptions_0.1.2         jquerylib_0.1.4
#> [107] MALDIquant_1.21             data.table_1.14.2
#> [109] bitops_1.0-7                GenomicRanges_1.47.6
#> [111] R6_2.5.1                    pcaMethods_1.87.0
#> [113] affy_1.73.0                 IRanges_2.29.1
#> [115] codetools_0.2-18            MASS_7.3-55
#> [117] assertthat_0.2.1            SummarizedExperiment_1.25.3
#> [119] rjson_0.2.21                rprojroot_2.0.2
#> [121] withr_2.4.3                 GenomeInfoDbData_1.2.7
#> [123] parallel_4.2.0              hms_1.1.1
#> [125] grid_4.2.0                  rmarkdown_2.11
#> [127] MatrixGenerics_1.7.0        lubridate_1.8.0